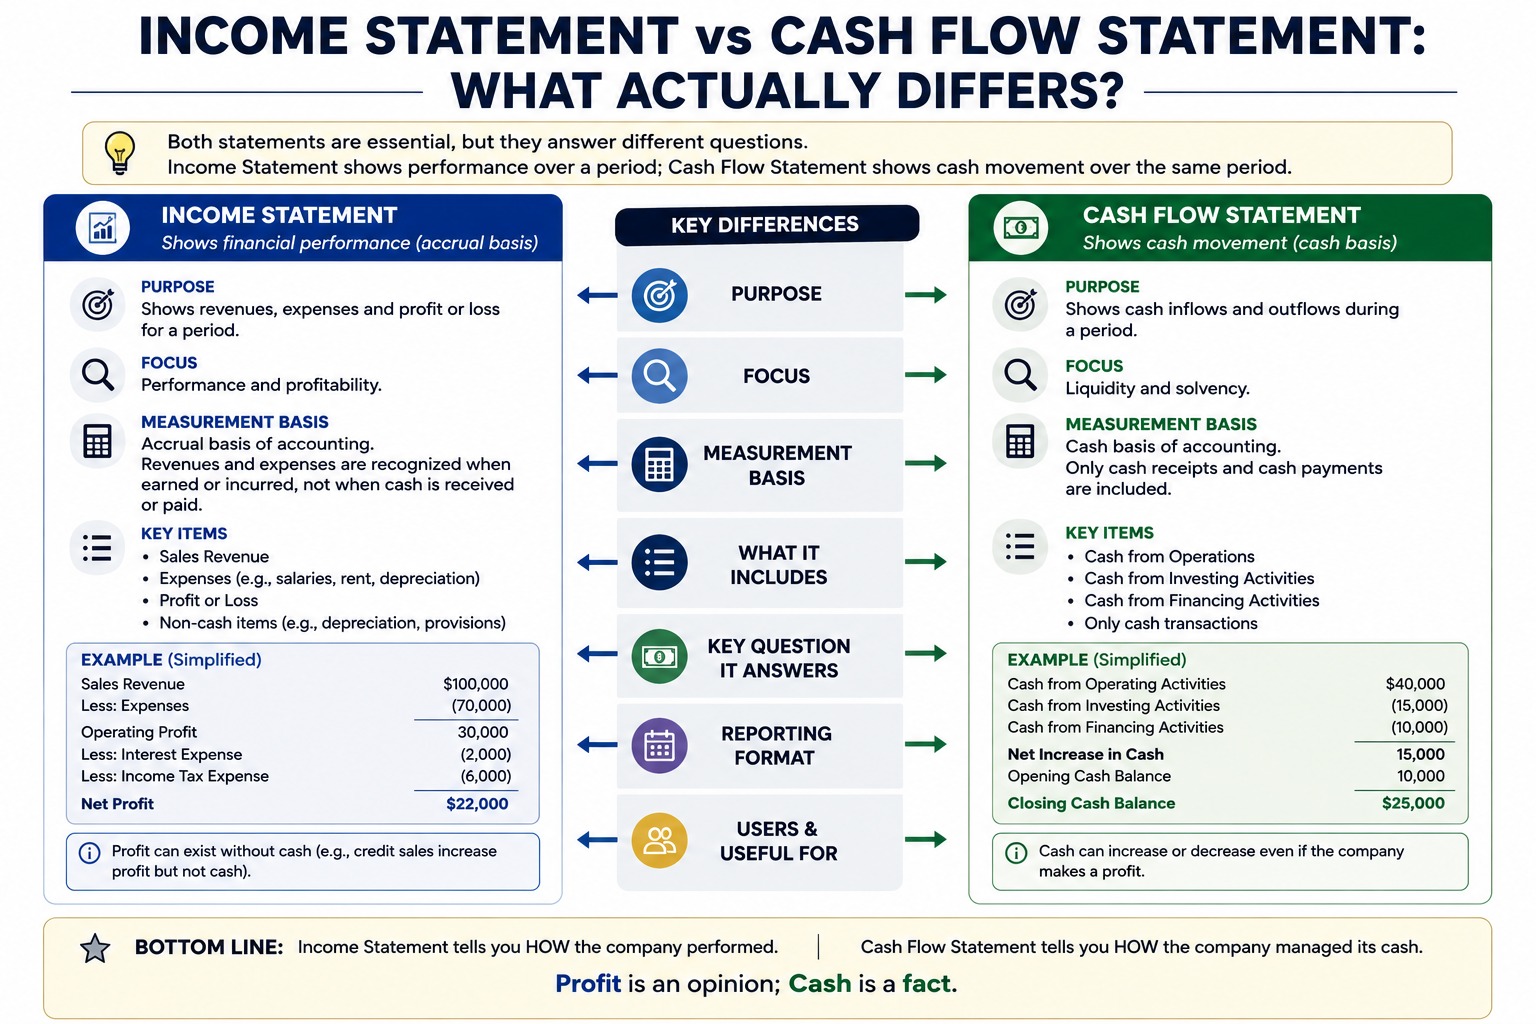
A business can report record profit and still fail to pay its bills. It can also bleed accounting losses while sitting on a growing pile of cash. Understanding why requires knowing exactly what the income statement and the cash flow statement each measure — and what they deliberately ignore.
Two different questions
| Income statement | Cash flow statement | |
|---|---|---|
| Question answered | Did the business create value this period? | Where did cash come from and where did it go? |
| Basis | Accrual — revenue when earned, expense when incurred | Cash — only actual movements of money |
| Key figure | Net income (profit or loss) | Net change in cash |
| Includes non-cash items? | Yes — depreciation, accruals, credit sales | No — if cash didn't move, it isn't here |
| Sections | Revenue, expenses, gains, losses | Operating, investing, financing activities |
Why profit ≠ cash
Four common culprits drive the gap:
- Credit sales. A $100,000 sale on account is revenue today, but the cash may arrive in 90 days — or never.
- Depreciation. A $60,000 machine bought last year hits this year's income statement as, say, $12,000 of depreciation expense — but not one dollar of cash left the business this year.
- Inventory build-up. Cash spent filling the warehouse doesn't become an expense until the goods are sold. Cash is gone; profit untouched.
- Loan principal. Repaying debt consumes cash but is not an expense (only the interest is).
This is why fast-growing companies are often cash-hungry: sales (and profit) grow on paper while cash is locked up in receivables and inventory. It's also why lenders read the cash flow statement first.
The three cash flow sections
- Operating activities — cash from the core business: collections from customers, payments to suppliers and employees, interest and tax paid. This is the section that should be positive for a healthy mature business.
- Investing activities — buying and selling long-term assets: equipment purchases, proceeds from asset sales, investments.
- Financing activities — cash between the business and its funders: loans received and repaid, share issues, dividends or drawings.
How the two statements connect
The indirect method of the cash flow statement makes the link explicit. It starts with net income and un-does the accrual items:
| Operating activities (indirect method) | $ |
|---|---|
| Net income | 25,000 |
| + Depreciation (non-cash expense) | 12,000 |
| − Increase in accounts receivable | (9,000) |
| + Increase in accounts payable | 4,000 |
| Net cash from operating activities | 32,000 |
Each adjustment answers the same question: did this income-statement item move cash by a different amount than it moved profit?
A worked reconciliation
The connection is easiest to see with numbers. Take a company reporting a healthy year:
| Line | $ |
|---|---|
| Profit for the year | 90,000 |
| Add back: depreciation | 25,000 |
| Less: gain on sale of equipment | (8,000) |
| Increase in accounts receivable | (40,000) |
| Increase in inventory | (30,000) |
| Increase in accounts payable | 12,000 |
| Net cash from operating activities | 49,000 |
Every line after the first exists because the income statement and the cash flow statement disagree about timing, and it is worth being precise about why each one moves the way it does.
Depreciation is added back because it reduced profit without anyone paying anything this year. The cash left when the asset was bought, and that outflow belongs to investing activities in the year it happened.
The gain on sale is deducted, which surprises people. It is not that the gain is unreal — it is that the entire proceeds from the sale appear under investing activities. Leaving the gain in operating too would count the same money twice.
The receivables increase is deducted because revenue was recognised on sales the company has not yet been paid for. Sales went up; cash did not follow. The same logic runs through inventory: stock bought and paid for but not yet sold sits on the balance sheet rather than in cost of sales.
The payables increase is added for the mirror-image reason. Expenses were recognised on invoices not yet settled, so profit fell but cash stayed put.
The classic trap: profitable and insolvent at once
Look again at that reconciliation. Profit was 90,000 and operating cash was 49,000 — the gap is almost entirely the 70,000 tied up in extra receivables and inventory. Now imagine the same business growing faster: sales double, receivables and inventory double with them, and the working capital drain exceeds the profit entirely. Operating cash flow turns negative in a year when the income statement looks better than ever.
This is how growing businesses fail. Not through losses, but through funding a widening gap between when they recognise revenue and when the money actually arrives. A firm can hold a full order book, report record profits, and still be unable to make payroll — because profit is an opinion about timing and cash is a fact about the bank balance.
The reverse also happens. A business can report a loss while generating strong cash, typically when a large non-cash charge such as an impairment or heavy depreciation drags profit down without touching the bank. Neither pattern is automatically good or bad; both are questions worth asking.
What each statement conceals
Read alone, each statement has blind spots the other covers.
- The income statement hides timing. It tells you a sale was made, not whether the customer is good for it. Revenue recognised on a receivable that is never collected still sits in profit until someone writes it off.
- The income statement hides capital intensity. Buying a factory does not appear at all; only the depreciation trickles through over years. Two businesses with identical profit can have very different cash demands.
- The cash flow statement hides obligations. Not paying suppliers improves operating cash flow immediately. It looks like strength and is often the opposite — stretching payables is borrowing from your suppliers without asking.
- The cash flow statement hides earning power. Selling a building produces a large investing inflow once. It says nothing about whether the business can repeat it.
Three patterns worth recognising
Reading the two together, certain combinations recur often enough to be worth naming:
- Profit rising, operating cash falling. Usually receivables or inventory growing faster than sales. Sometimes growth; sometimes revenue being recognised too early or collected too slowly.
- Losses reported, operating cash positive. Often a large non-cash write-down. The underlying trading may be sound, so check what the charge was and whether it recurs.
- Operating cash consistently below profit, year after year. A one-year gap is timing. A persistent gap suggests profit is being recognised on a basis the cash never validates.
Which statement matters more?
Neither — they discipline each other. Profit without cash flow raises questions about collection and sustainability; cash flow without profit (say, from borrowing) isn't a business model. Analysts routinely compare operating cash flow to net income: persistently lower cash flow than profit is a classic early warning sign.
Test yourself
Can you build both statements from the same set of transactions? That's the real test of whether the difference has clicked. Accountely has graded income statement and cash flow challenges — including direct and indirect method cash flows with line-by-line feedback — and MCQ drills for quick concept checks. Free to try.